Case study · 2026
Agent Mission Control
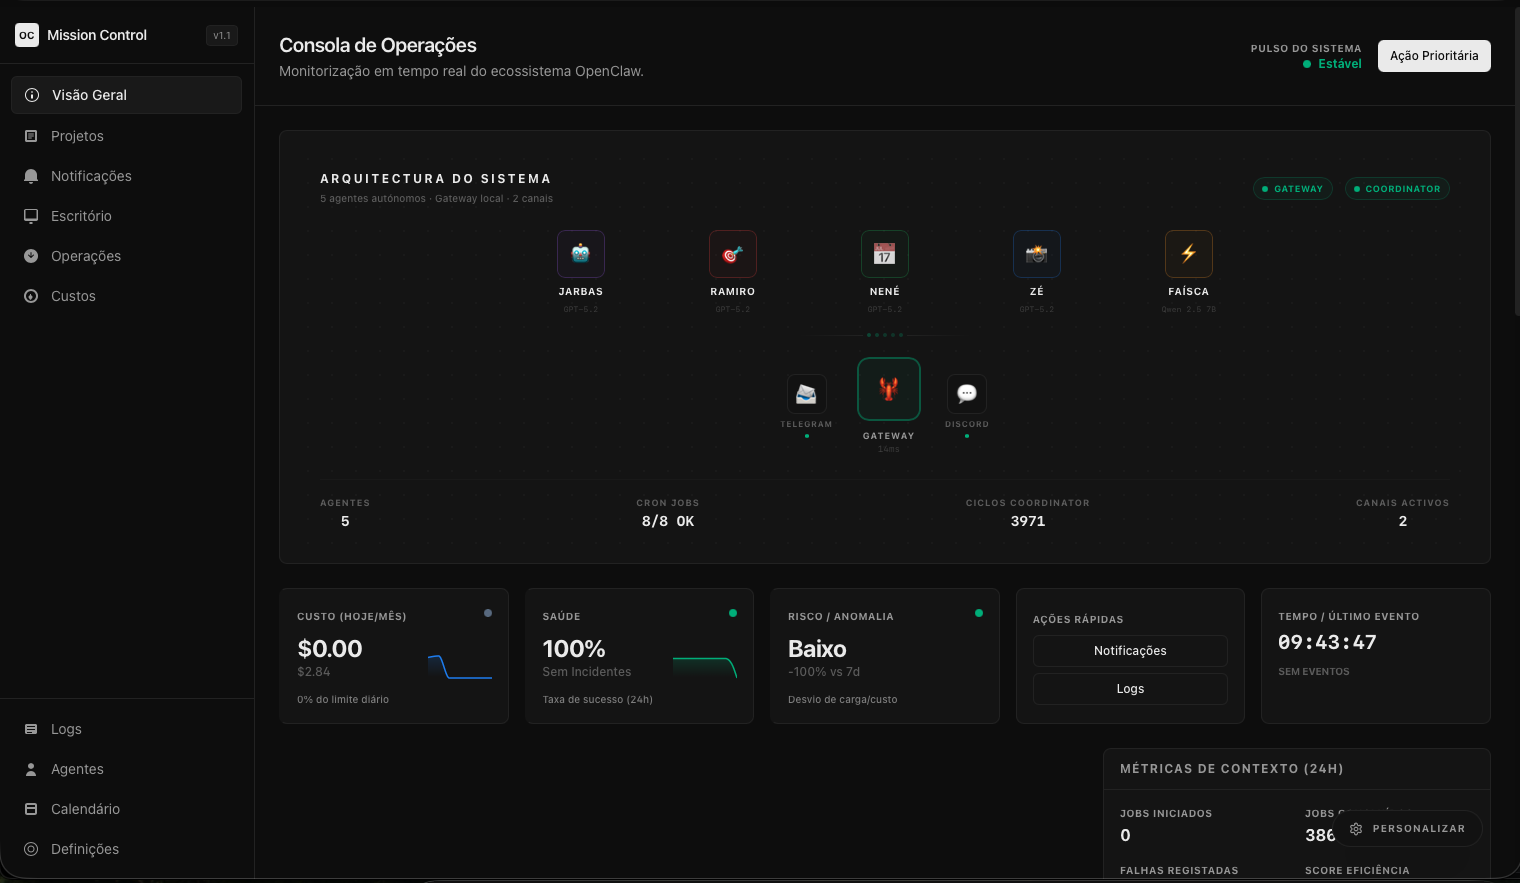
Operations dashboard for a 5-agent AI orchestration platform: real-time costs, session tracing, approval queues and budget controls in a single pane.
Context
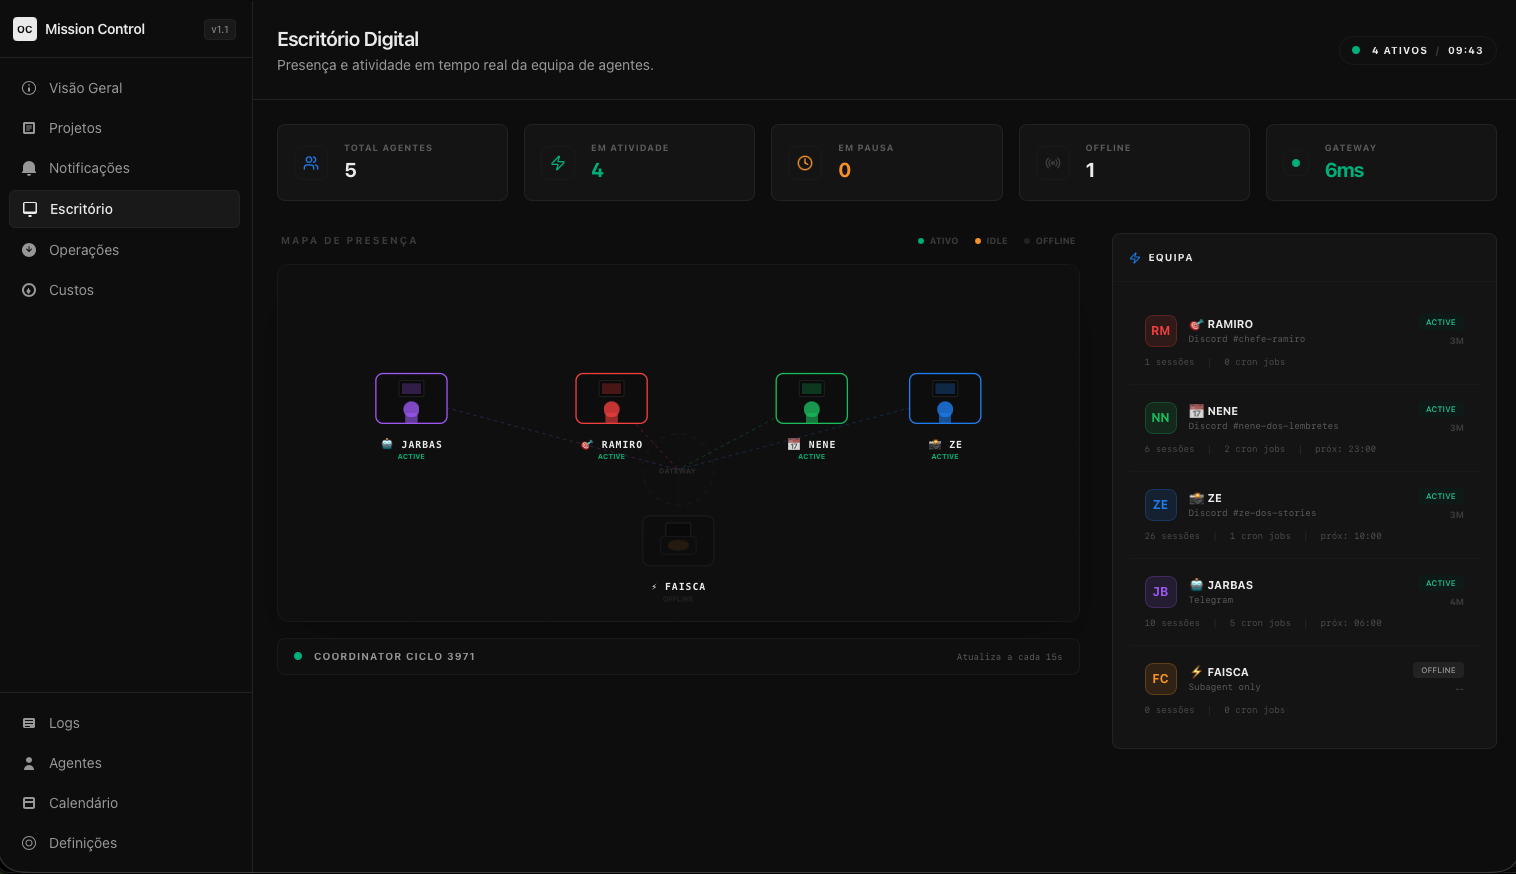
OpenClaw is my personal agent orchestration platform: 5 AI agents (4 cloud, 1 local) operating through Telegram and Discord, with a coordinator loop running every 5 minutes and 8 scheduled jobs per day.
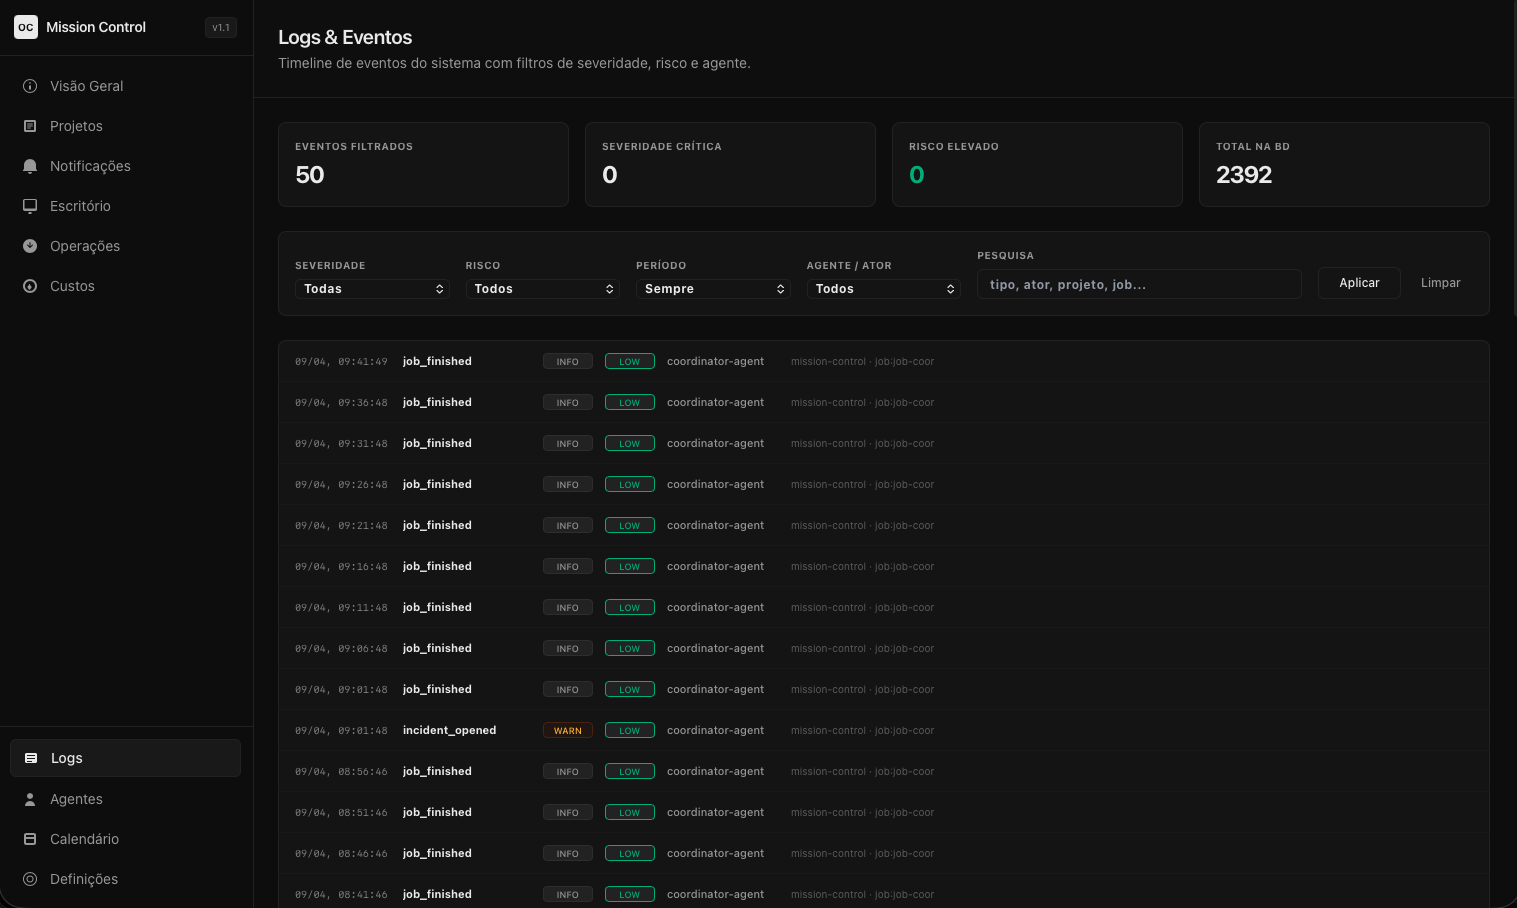
A system like this continuously produces cost, failures and session state - and all of it lived scattered across logs.
Problem
Decisions were made blind: no visibility into per-agent cost, active sessions, pending approvals or budget overruns. Incidents and stale approvals were only discovered late. What was missing was a real operations panel - not more logs.
Constraints
- Everything runs on a single local node (Mac mini) - no cloud infrastructure or managed services.
- Agent sessions are JSONL files on disk; the dashboard has to tail them in near real time.
- Processes are managed by macOS LaunchAgents - the dashboard must survive restarts without intervention.
Decisions
- SQLite in WAL mode instead of a database service: on a single-node system it removes operational overhead and is enough for 14 tables with Zod validation.
- Server-Sent Events instead of WebSockets for session tailing: the flow is one-directional, and SSE is simpler to serve and to recover.
- Server components query SQLite directly for most pages; client components poll at 10–30s intervals only where data is live.
- Budget control with daily/monthly limits and auto-pause on breach - guardrails enforced by the coordinator loop, not by the UI.
Technical approach
Next.js 15 (App Router) with 25+ API routes powering the panel: gateway status, cron and coordinator monitoring, per-agent 24h metrics, an approval queue with risk levels and expiration timers, and SSE session streaming.
The dashboard is customisable - drag-and-drop widgets with configuration persisted in SQLite - and includes a topology graph of delegation relationships between agents.
Outcome
A single panel shows real-time cost, a health score, anomaly detection and trends; the budget auto-pauses agents on breach. Automated health checks run twice a day through a dedicated QA API.
Decisions about the system - pause, resume, rerun, authorise - are now made with data in front of me, from the browser.
Known limitations
- The interface is Portuguese-only - no language toggle yet.
- SQLite is single-node: no replication or clustering.
- The SSE stream reads JSONL from disk - high session volume may lag.
- Cost estimation falls back to per-event approximation when agents do not emit a total cost.
Learnings
- Building the panel forced me to formalise what was previously implicit: what "healthy" means, what a day may cost, when an approval expires.
- SSE plus short polling covers an operations dashboard’s "real time" needs without the operational complexity of WebSockets.